

A wise man once said, if you are a Java developer long enough you’ll eventually run into an OutOfMemoryError in production. This is the harsh fate that I met recently on a Spring Boot application I was working on.
I wrote this article to share a few of my learnings while investigating this error. This article is a good starting point to help you debug your OutOfMemoryError.
Grab your ☕️ and let’s dive right in.
TL;DR
- OutOfMemoryError is (basically) caused by a lack of heap space
- Isolate the part of the code that triggers the issue using tools like MAT to analyse a heap dump, and either fix your code or increase the heap size
- Configure your JVM to make it deterministic and detect a potential OutOfMemoryError early
Table of content
The mighty JVM
Java memory management
OutOfMemoryError types
Debugging an OutOfMemoryError
A deterministic JVM
Tips to detect an OutOfMemoryError early
Conclusion
The mighty JVM
To understand the root cause of an OutOfMemoryError, we first need to understand what the JVM is and how it is related to this error.
In the 1990s, well before the rise of docker and containerisation, Java delivered one promise thanks to the JVM (Java Virtual Machine): write once, run everywhere.
Java is a programming language that needs to be compiled. This is done by using the javac utility, which generates bytecode. The JVM is a piece of software that interprets this bytecode and turns it into machine code. Note that although bytecode is not platform dependant, the JVM is.
The JVM is also responsible for memory management.
Java memory management
When you start a Java program, the JVM will reserve different memory areas for different purposes. The one we are interested in is the heap area.
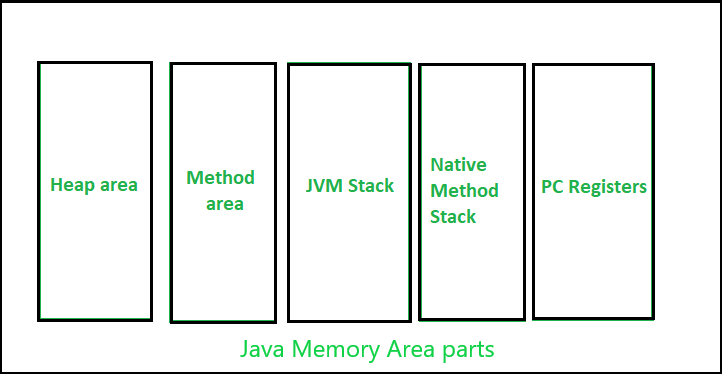
The heap is the memory area where the JVM stores the objects that you instantiate in your code. When an instantiated object is no longer needed, it is freed from memory by the garbage collector (GC), which is managed by the JVM as well.
So when does an OutOfMemoryError occur? When you no longer have enough free space to store a new object in the heap.

OutOfMemoryError types
Well, I lied. The truth is there are other causes that could trigger an OutOfMemoryError other than the lack of heap space. In this Oracle documentation they list (and explain the possible cause of) 7 types of errors:
- java.lang.OutOfMemoryError: Java heap space
- java.lang.OutOfMemoryError: GC Overhead limit exceeded
- java.lang.OutOfMemoryError: Requested array size exceeds VM limit
- java.lang.OutOfMemoryError: Metaspace
- java.lang.OutOfMemoryError: request size bytes for reason. Out of swap space?
- java.lang.OutOfMemoryError: Compressed class space
- java.lang.OutOfMemoryError: reason stack_trace_with_native_method
You can also have a look at this repository with samples of code that trigger the different OutOfMemoryError types.
One common error type is the GC Overhead limit exceeded error. As per Oracle documentation :
"GC Overhead limit exceeded" indicates that the garbage collector is running all the time and Java program is making very slow progress. [...] This exception is typically thrown because the amount of live data barely fits into the Java heap having little free space for new allocations.
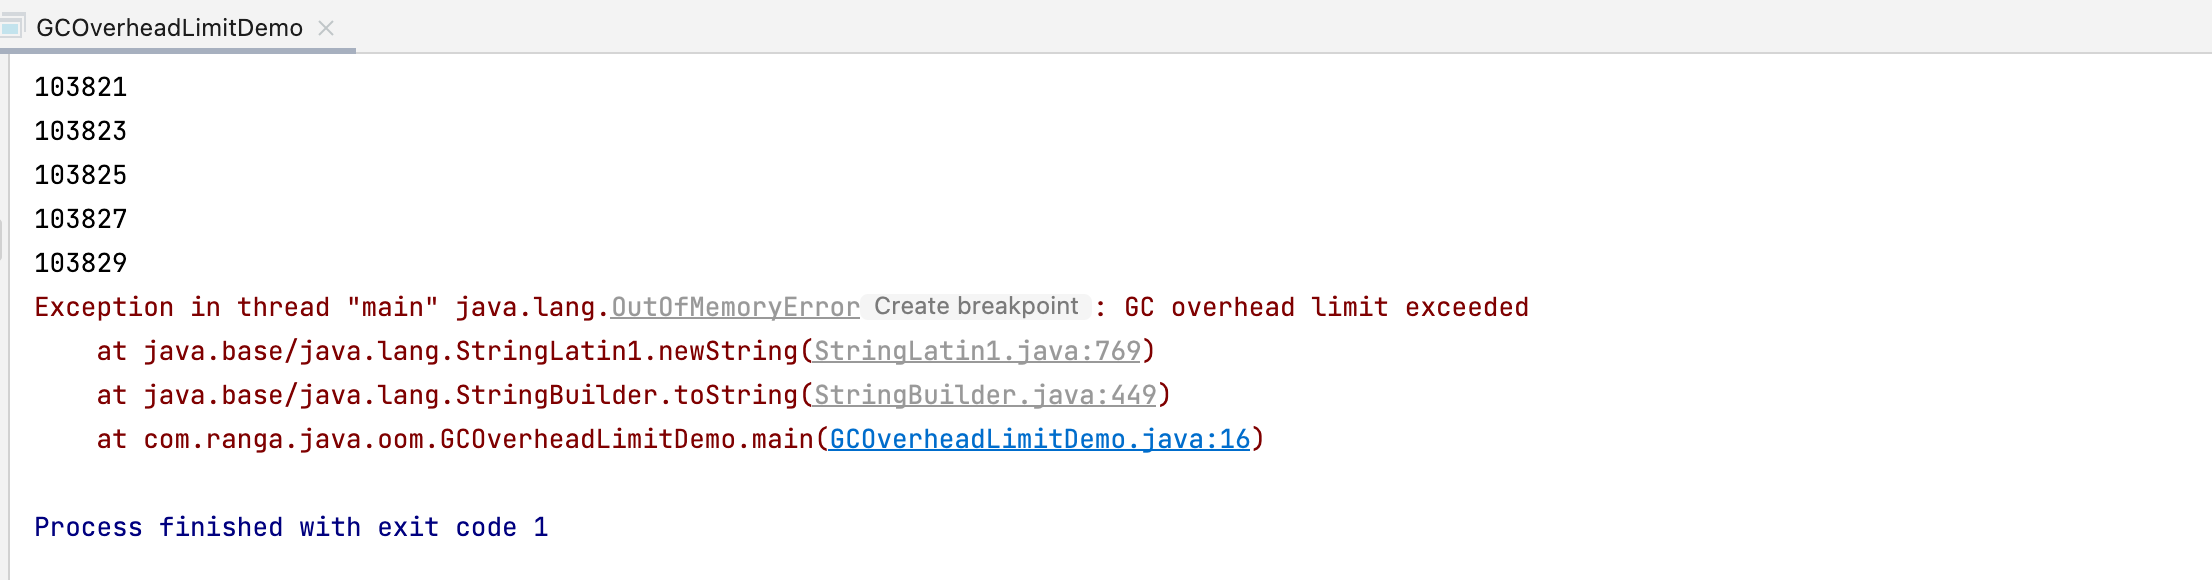
Let's take a code sample that triggers this error, and see how to debug it.
Debugging an OutOfMemoryError

Two interesting tools to debug your OutOfMemoryError are:
- VisualVM (free tool maintained by Oracle)
- MAT (free open source software maintained by Eclipse Foundation)
We are going to demonstrate them using the GCOverheadLimitDemo from the repository mentioned previously.
Let's say we want to generate 1.000.000 Employee objects and insert them into a database. We want to avoid inserting each object separately into the DB as each request to the DB is costly. Instead, we want to insert a list of Employee objects. Here is the corresponding code:
// GCOverheadLimitDemo.java
// JVM Parameters: -Xms10m -Xmx10m -XX:+UseZGC
// We limit the JVM Heap memory to 10MB

package com.ranga.java.oom;

import java.util.ArrayList;
import java.util.List;

public class GCOverheadLimitDemo {
    public static void main(String[] args) {
        List<Employee> list = new ArrayList<>();

        // Added this line to have enough time to configure VisualVM
        // before the end of code execution
        Thread.sleep(5000);

        for(int count=0; count<1000000; count++) {
            System.out.println(++count);
            long id = count;
            String name = "Ranga " + id;
            int age = count > 100 ? count % 100 : count;
            float salary = count * 0.05f;
            Employee employee = new Employee(id, name, age, salary);
            list.add(employee);
        }

        // Insert Employees into database here
    }
}
Below the result of the code execution:
Monitoring with VisualVM
Using VisualVM we can monitor the heap memory usage as well as the garbage collector activity.
To do so, we need to execute our code and tell VisualVM to monitor the corresponding JVM (straightforward operation). Below is the result:
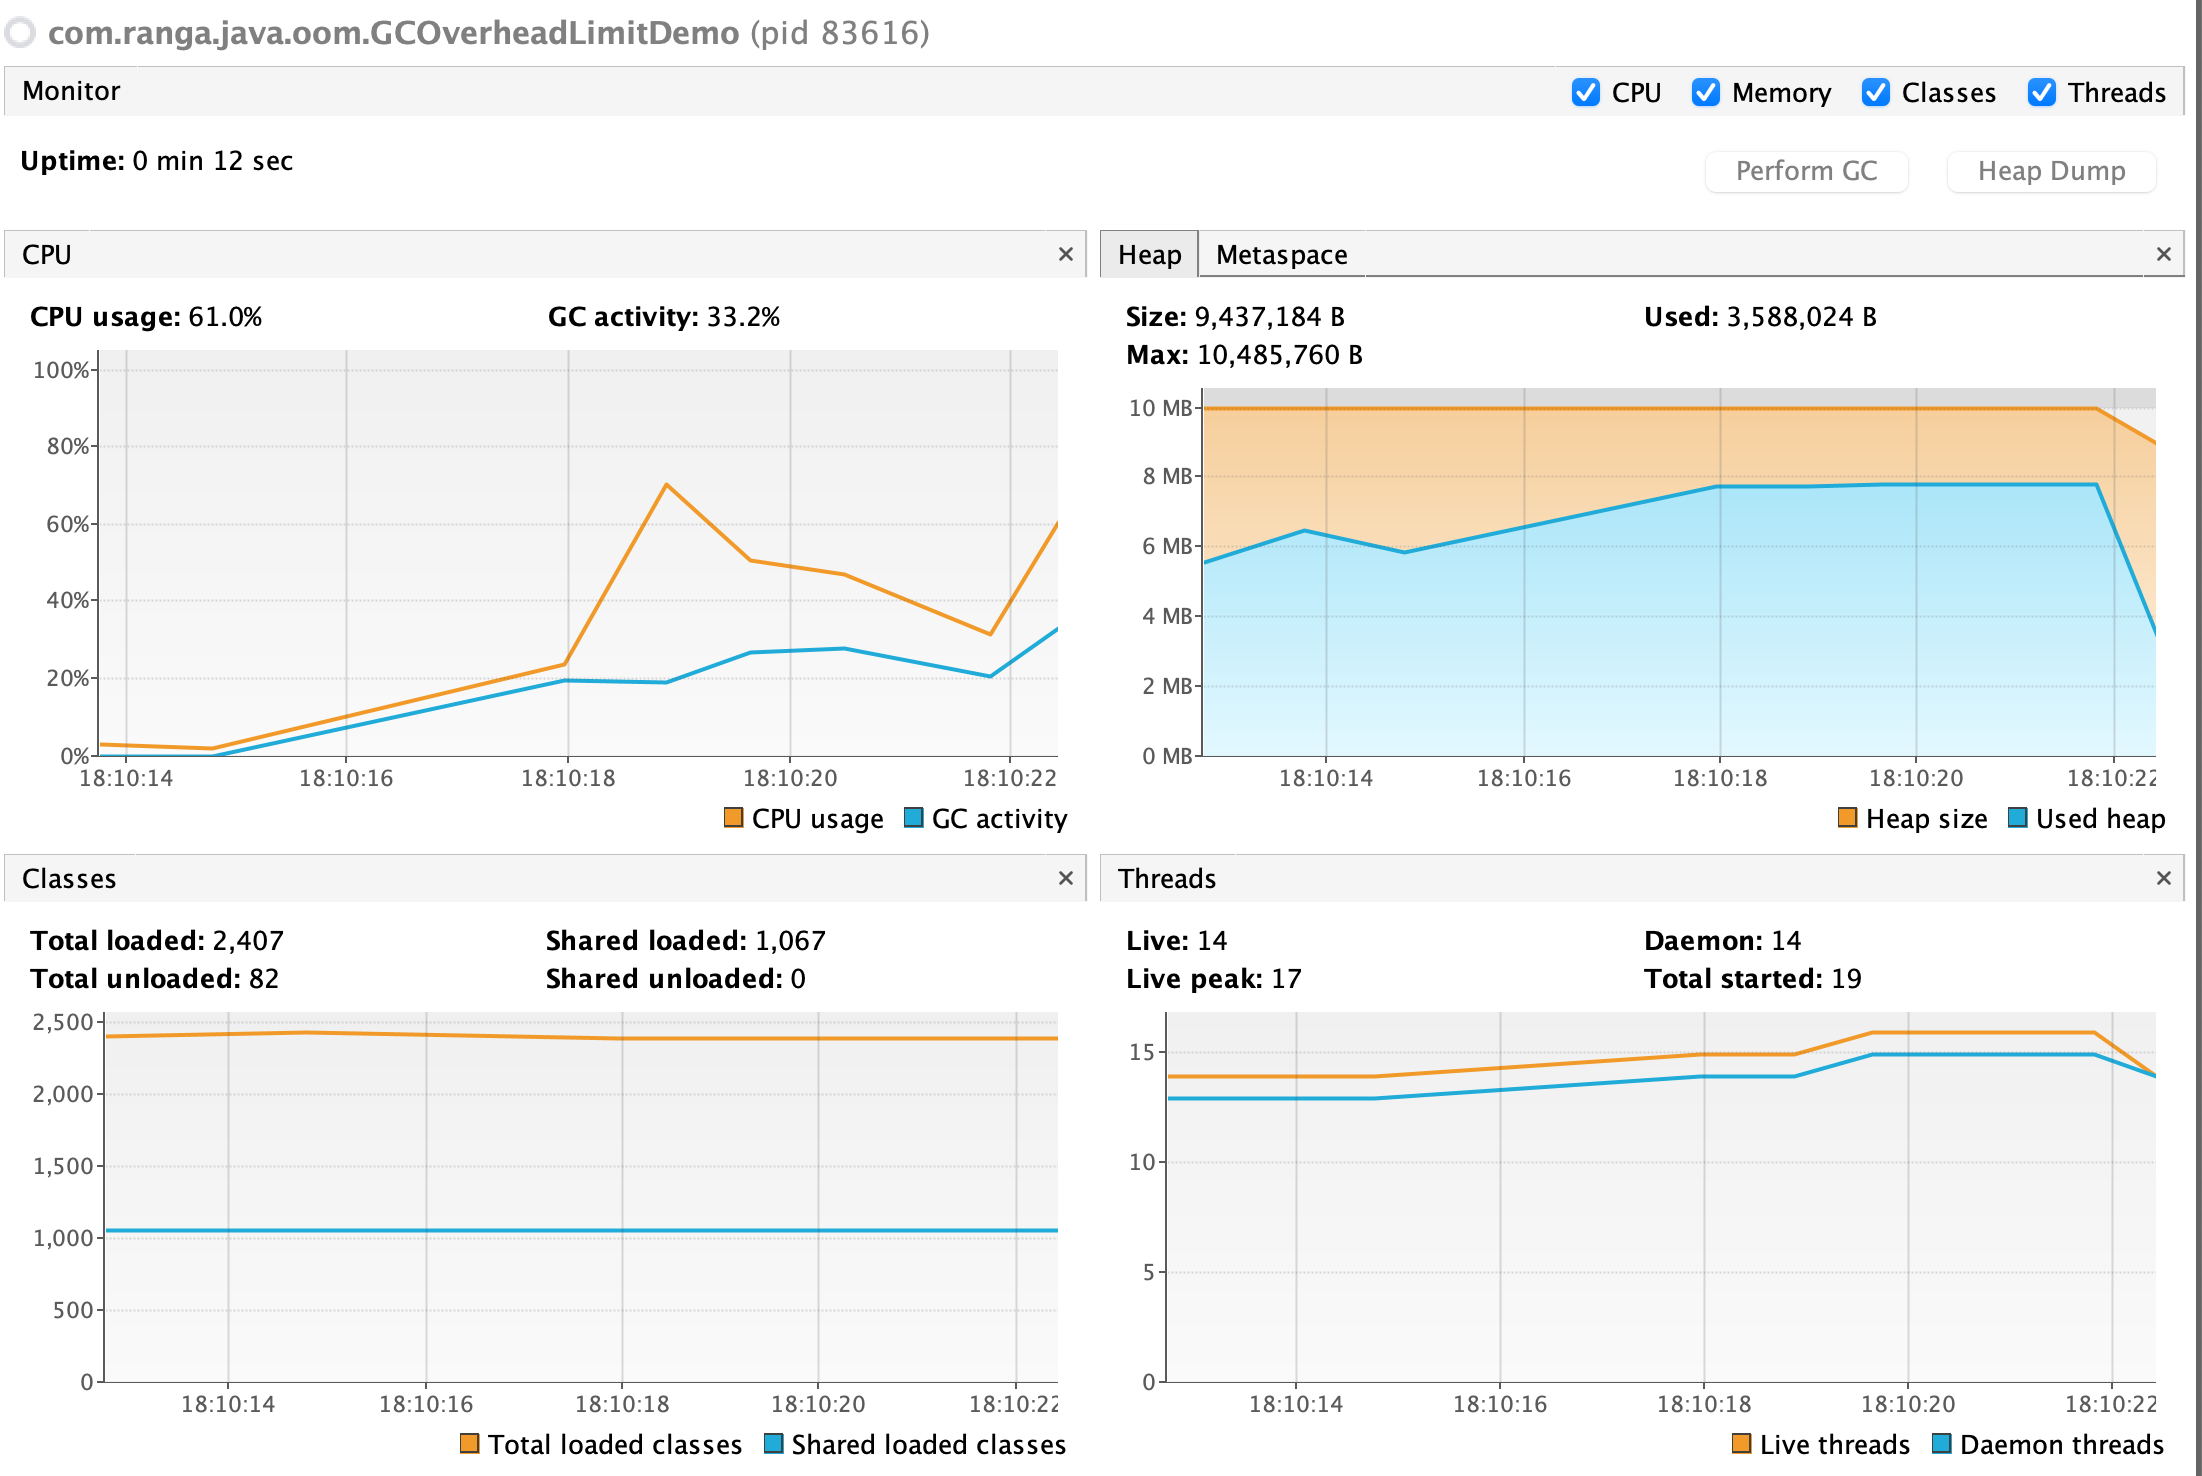
We can see that right before the OutOfMemoryError was triggered, the GC activity peaked. Excessive GC activity triggered the GC Overhead limit exceeded error and caused the code to crash.
Next we need to isolate the part of the code that triggered this error.
Heap dump analysis with MAT
You can configure the JVM to generate a heap dump when an OutOfMemoryError is triggered. A heap dump is a snapshot of the heap. It contains all the objects that were stored in the heap at the moment it was generated. The goal is to analyse further the objects constituting the heap dump to get a hint on the actual code that triggered the OutOfMemoryError. To achieve this you can add the following JVM parameter -XX:+HeapDumpOnOutOfMemoryError .
When the OutOfMemoryError occurs, it generates a .hprof file. This file can be analysed using MAT. Note that before the heap is generated, a GC cycle is triggered and therefore the dump only contains live objects.
Below is the result for GCOverheadLimitDemo example:
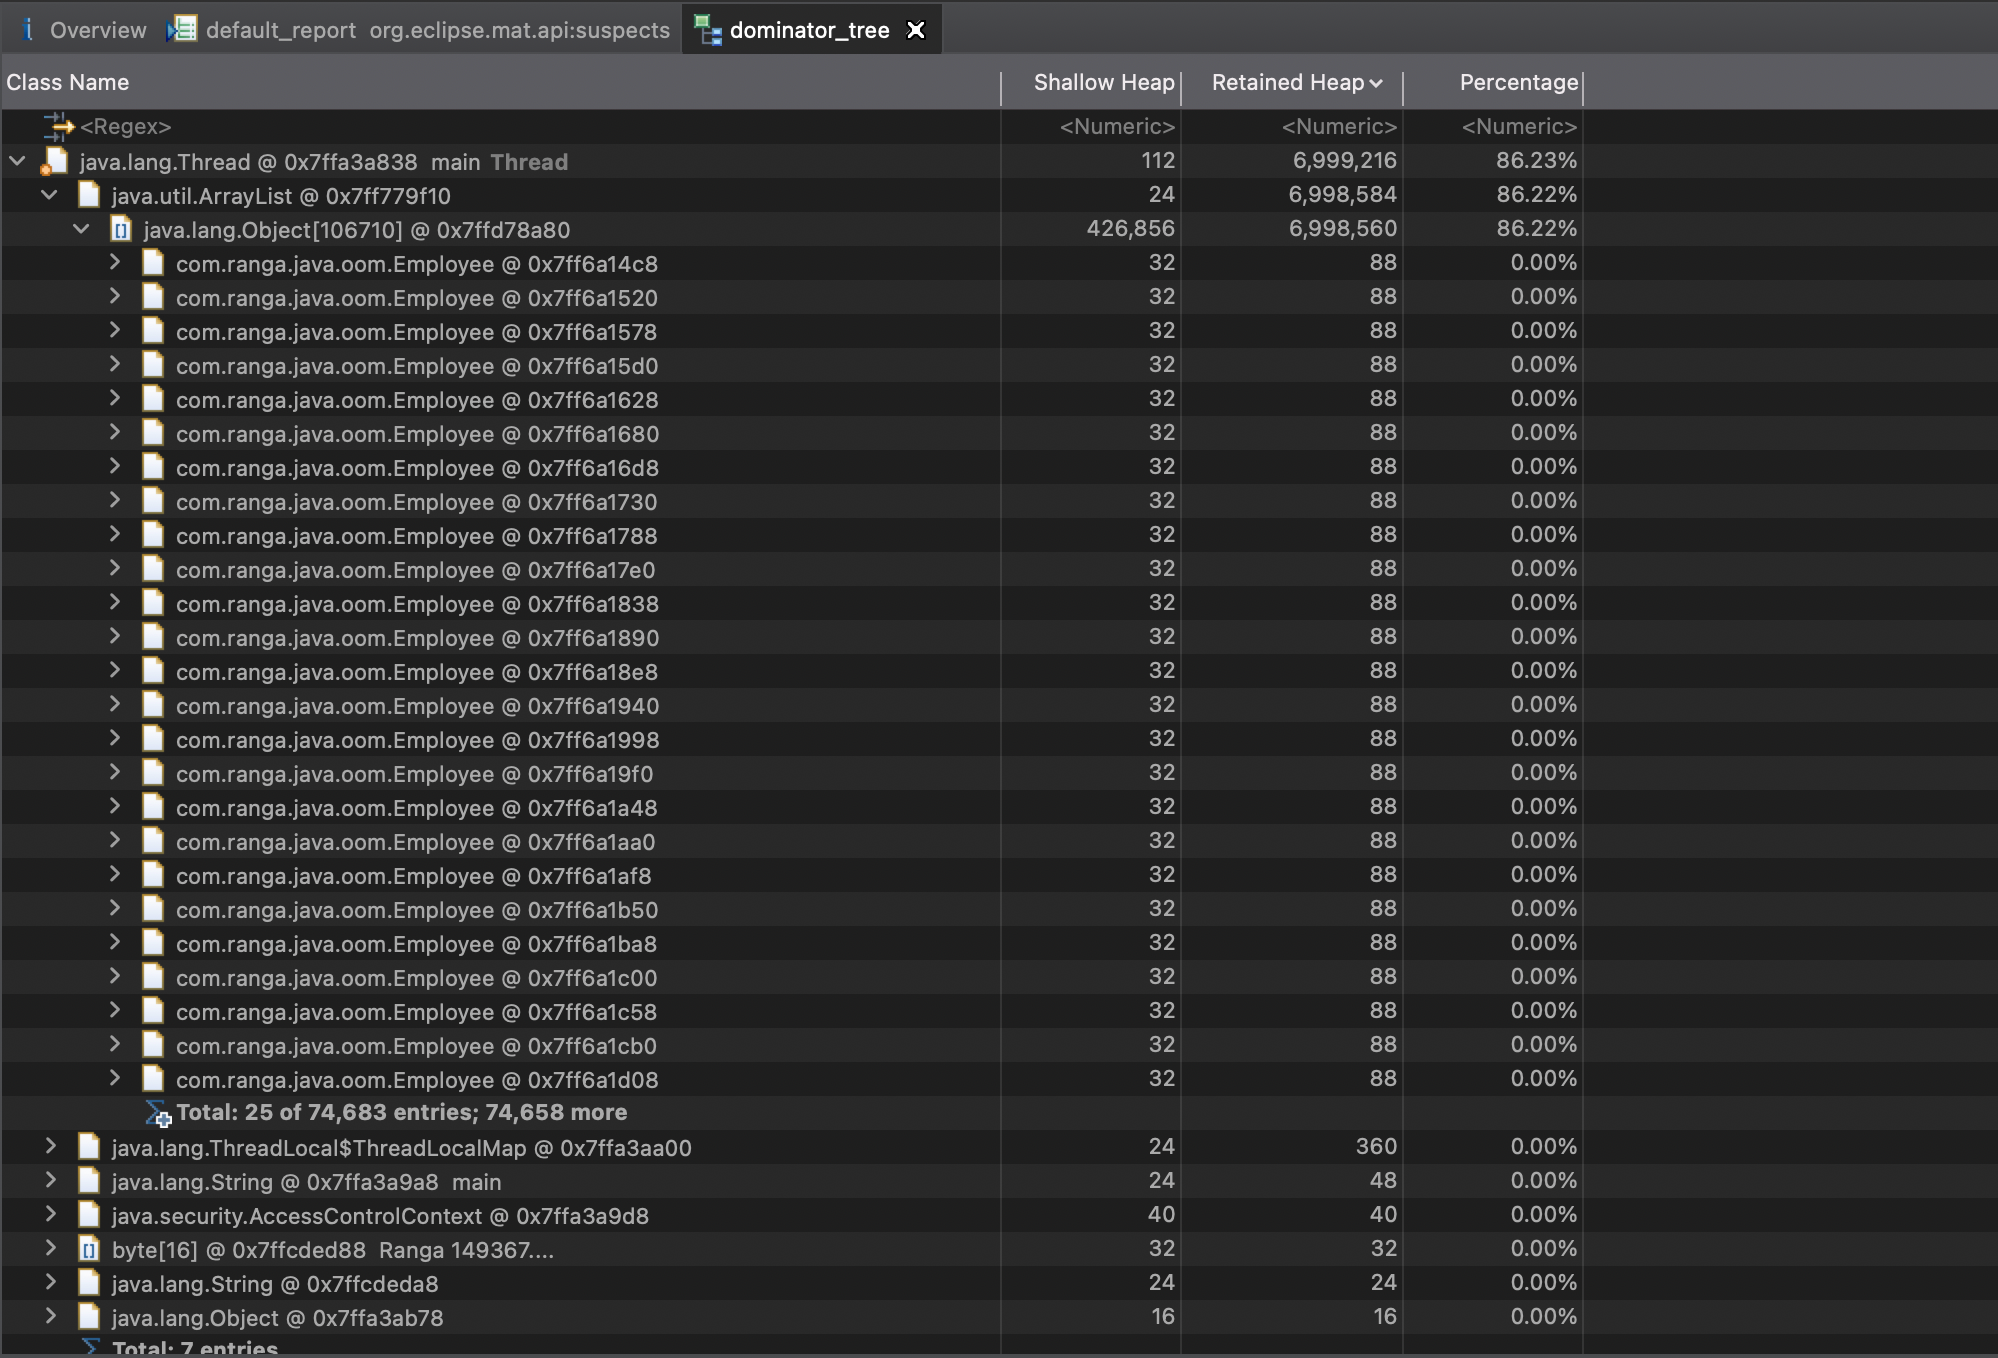
We can clearly see that the object that is taking most of heap space is an ArrayList of Employee objects. We can now look for places in the code where we instantiate such objects. Then we either fix the part of the code responsible for the error or we increase the heap maximum size.
In our example, if we don't want or can't increase the heap maximum size, we can insert Employee objects by batch of 10.000 instead of 1.000.000:
package com.ranga.java.oom;

import java.util.ArrayList;
import java.util.List;

public class GCOverheadLimitDemo {
    public static void main(String[] args) {

        List<Employee> list;

        for(int i=0; i < 100; i++){
            // At the end of each loop, the initial list can be
            // Garbage collected, thus releasing memory
            list = new ArrayList();

            for(int count=0; count<10000; count++) {
                long id = count;
                String name = "Ranga " + id;
                int age = count > 100 ? count % 100 : count;
                float salary = count * 0.05f;
                Employee employee = new Employee(id, name, age, salary);
                list.add(employee);
            }

            // Insert list into database here
        }
    }
}
Other tools to debug your OutOfMemoryError
Other tools worth mentioning to help you debug an OutOfMemoryError:
- Jprofiler (paid software by Oracle)
- spring-boot-actuator if you are running a Spring Boot backend (free)
- Java flight recorder (JFR) to register a JVM activity (free for non production usage only)
A deterministic JVM
One important thing to consider before pushing your Java code into production is your JVM settings. There are a lot of resources that list the most important parameters to configure, like this article or Oracle documentation. I highly recommend to check it out before reading further.
TLDR; it is considered best practice to at least configure:
- The heap memory size using
-Xms(heap minimum size) and-Xmx(heap maximum size) - The garbage collector algorithm like
-XX:+UseZGCto use Z Garbage Collector algorithm for example
Let's say you have an app.jar that you want to execute, you would use for example : java -Xms10m -Xmx1G -XX:+UseZGC -j api.jar .
Tips to detect an OutOfMemoryError early
Ideally one would detect an OutOfMemoryError way before the code is pushed to production. Here are a few tips to help you achieve that:
- Configure your JVM to use as little heap memory as possible. This will help you detect ealry the memory and / or performance bottlenecks, starting from your local environment
- Be “iso production” in all your environments (including local environment), this means using in all your environments:
- The same JVM / JDK versions
- The same configuration for the JVM
- The same volume of data (if for example you use a big database in production, use in other environments a database with equivalent amount of data)
- Load test your code to simulate a production load (you can use tools like k6 or Gatling)
Conclusion
We explored how to debug and detect early an OutOfMemoryError in your Java code. I wrote this article after facing myself the same situation in production within a Spring Boot backend. When working with such backends there are other performance challenges to tackle, like the infamous N+1 query problem. You can check this article if you want to learn how to tackle N+1 query issues within a Spring Boot backend.
Keep Javaing ✌️